otlp学习笔记
OTLP
- MeterProvider is the entry point of the API. It provides access to Meters
- API MeterProvider only provides ability to create a Meter
- SDK MeterProvider accepts configuration for Resource association, metric processing, and exporters
- Meter is responsible for creating Instruments
Instrument is responsible for reporting Measurements
EU 2023
使用的基础设施
observability-backend           grafana-65888b98d-lvdv8                                      1/1     Running     0               25d
observability-backend           loki-0                                                       1/1     Running     0               25d
observability-backend           mimir-0                                                      1/1     Running     0               25d
observability-backend           otel-collector-9d57bfcfc-ngrkd                               1/1     Running     0               19m
observability-backend           otel-prom-cr-collector-0                                     1/1     Running     3 (3m44s ago)   4m2s
observability-backend           otel-prom-cr-collector-1                                     1/1     Running     0               4m2s
observability-backend           otel-prom-cr-collector-2                                     1/1     Running     2 (3m45s ago)   4m2s
observability-backend           otel-prom-cr-targetallocator-668cbf96bc-26dhc                1/1     Running     0               4m2s
observability-backend           otel-prom-cr-targetallocator-668cbf96bc-vc4rn                1/1     Running     0               4m2s
observability-backend           tempo-694776547f-99rr8                                       1/1     Running     0               25d
使用 opentelemetry-operator.yaml 0.74 版本
安装完出现两个crd
It manages two CustomResourceDefinitions (CRDs):
opentelemetrycollectors.opentelemetry.io, short nameotelcolinstrumentations.opentelemetry.io, short nameotelinst
❯ k get crd | grep opentelemetry
instrumentations.opentelemetry.io                     2025-01-17T07:45:30Z
opentelemetrycollectors.opentelemetry.io              2025-01-17T07:45:31Z
otelcol
部署下面的yaml
apiVersion: opentelemetry.io/v1alpha1
kind: OpenTelemetryCollector
metadata:
  name: otel
spec:
  image: ghcr.io/open-telemetry/opentelemetry-collector-releases/opentelemetry-collector-contrib:0.74.0
  mode: deployment # statefulset, daemonset, sidecar
  autoscaler:
    targetCPUUtilization: 90
    minReplicas: 1
    maxReplicas: 5
  ingress:
    hostname: ...
  config: | # contains OpenTelemetry collector configuration
    receivers:
      otlp:
        protocols:
          grpc:
          http:
    processors:
      batch:

    exporters:
      logging:

    service:
      pipelines:
        traces:
          receivers: [otlp]
          processors: [batch]
          exporters: [logging]
会出现一个svc
❯ kubectl get svc otel-collector -n observability-backend
NAME             TYPE        CLUSTER-IP     EXTERNAL-IP   PORT(S)                       AGE
otel-collector   ClusterIP   10.233.2.244   <none>        4317/TCP,4318/TCP,55681/TCP   8m20s
增加如下内容
    receivers:
      jaeger:
        protocols:
          grpc:
          thrift_binary:
          thrift_compact:
          thrift_http:

    service:
      pipelines:
        traces:
          receivers: [otlp, jaeger]
          processors: [memory_limiter, batch]
会出现两个svc
❯ kubectl get svc |grep otel-collector
otel-collector              ClusterIP   10.233.2.244    <none>        14250/TCP,6832/UDP,6831/UDP,14268/TCP,4317/TCP,4318/TCP,55681/TCP   10m
otel-collector-headless     ClusterIP   None            <none>        14250/TCP,6832/UDP,6831/UDP,14268/TCP,4317/TCP,4318/TCP,55681/TCP   10m
otel-collector-monitoring   ClusterIP   10.233.31.250   <none>        8888/TCP                                                            10m
otelinst
The operator use pod mutating webhook to inject auto-instrumentation libraries into starting pods. The webhook adds an init container that copies auto-instrumentation libraries into a volume that is mounted as well to the application container and it configures runtime (e.g. in JVM via JAVA_TOOL_OPTIONS) to load the libraries.
apiVersion: opentelemetry.io/v1alpha1
kind: Instrumentation
metadata:
  name: my-instrumentation
  namespace: tutorial-application
spec:
  exporter:
    endpoint: http://otel-collector.observability-backend.svc.cluster.local:4317
  propagators:
    - tracecontext
    - baggage
    - b3
  sampler:
    type: parentbased_traceidratio
    argument: "1"
  resource:
    addK8sUIDAttributes: false
  python:
    env:
      # Required if endpoint is set to 4317.
      # Python autoinstrumentation uses http/proto by default
      # so data must be sent to 4318 instead of 4317.
      - name: OTEL_EXPORTER_OTLP_ENDPOINT
        value: http://otel-collector.observability-backend.svc.cluster.local:4318
  java:
    env:
      - name: OTEL_LOGS_EXPORTER
        value: otlp
增加注解
# js
kubectl patch deployment frontend-deployment -n tutorial-application -p '{"spec": {"template":{"metadata":{"annotations":{"instrumentation.opentelemetry.io/inject-sdk":"true"}}}} }'
# python
kubectl patch deployment backend1-deployment -n tutorial-application -p '{"spec": {"template":{"metadata":{"annotations":{"instrumentation.opentelemetry.io/inject-python":"true"}}}} }'
# java
kubectl patch deployment backend2-deployment -n tutorial-application -p '{"spec": {"template":{"metadata":{"annotations":{"instrumentation.opentelemetry.io/inject-java":"true"}}}} }'
完整的调用关系
flowchart LR
    subgraph namespace: observability-backend
        subgraph pod: collector
            OC{OTel Collector}
        end
        subgraph pod: mimir
            OC --metrics-->Mimir
        end
        subgraph pod: loki
            OC --logs-->Loki
        end
        subgraph pod: tempo
            OC --traces-->Tempo
        end
        subgraph pod: grafana
            grafana-.->Mimir
            grafana-.->Loki
            grafana-.->Tempo
        end
    end
    subgraph namespace: app
        subgraph pod: loadgen
            LG((loadgen))
        end
        subgraph pod: frontend
            LG --http--> F((frontend)) --metrics,traces--> OC
        end
        subgraph pod: backend1
            F --http--> B1((backend1)) --metrics,traces--> OC
        end
        subgraph pod: backend2
            F --http--> B2((backend2)) --logs,metrics,traces--> OC
        end
    end
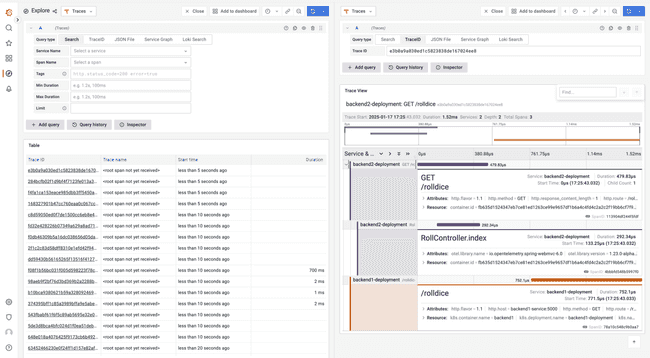
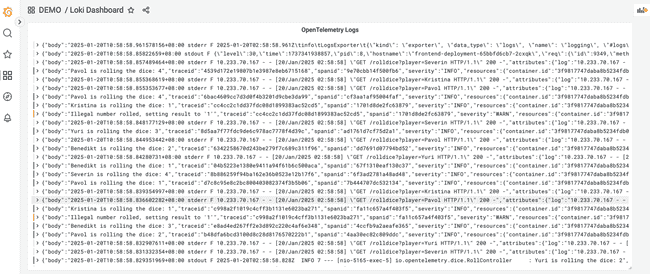
前端触发一下,能在grafana里看到,
同时我们也看看注入的内容
  containers:
  - env:
    - name: OTEL_EXPORTER_OTLP_ENDPOINT
      value: http://otel-collector.observability-backend.svc.cluster.local:4318
    - name: PYTHONPATH
      value: /otel-auto-instrumentation/opentelemetry/instrumentation/auto_instrumentation:/otel-auto-instrumentation
    - name: OTEL_TRACES_EXPORTER
      value: otlp
    - name: OTEL_EXPORTER_OTLP_TRACES_PROTOCOL
      value: http/protobuf
    - name: OTEL_METRICS_EXPORTER
      value: otlp
    - name: OTEL_EXPORTER_OTLP_METRICS_PROTOCOL
      value: http/protobuf
    - name: OTEL_SERVICE_NAME
      value: backend1-deployment
    - name: OTEL_RESOURCE_ATTRIBUTES_POD_NAME
      valueFrom:
        fieldRef:
          apiVersion: v1
          fieldPath: metadata.name
    - name: OTEL_RESOURCE_ATTRIBUTES_NODE_NAME
      valueFrom:
        fieldRef:
          apiVersion: v1
          fieldPath: spec.nodeName
    - name: OTEL_PROPAGATORS
      value: tracecontext,baggage,b3
    - name: OTEL_TRACES_SAMPLER
      value: parentbased_traceidratio
    - name: OTEL_TRACES_SAMPLER_ARG
      value: "1"
    - name: OTEL_RESOURCE_ATTRIBUTES
      value: k8s.container.name=backend1,k8s.deployment.name=backend1-deployment,k8s.namespace.name=tutorial-application,k8s.node.name=$(OTEL_RESOURCE_ATTRIBUTES_NODE_NAME),k8s.pod.name=$(OTEL_RESOURCE_ATTRIBUTES_POD_NAME),k8s.replicaset.name=backend1-deployment-759d95c666
Resource attributes
资源属性
There are several ways how essential Kubernetes resource attributes (Namespace, Deployment, ReplicaSet, Pod name and UIDs) can be collected:
- The
InstrumentationCR - operator injects the attributes to the application container viaOTEL_RESOURCE_ATTRIBUTESenv var. The OpenTelemetry SDK used in the auto-instrumentation reads the variable. - The
OpenTelemetryCollectorCR - the k8sattributesprocessor enriches spans with attributes in the collector - The
OpenTelemetryCollectorCR - in thesidecarmode use resourcedetectionprocessor. The operator setsOTEL_RESOURCE_ATTRIBUTESwith Kubernetes resource attributes and the variable can be consumed byenvdetector see the blog post for more details.
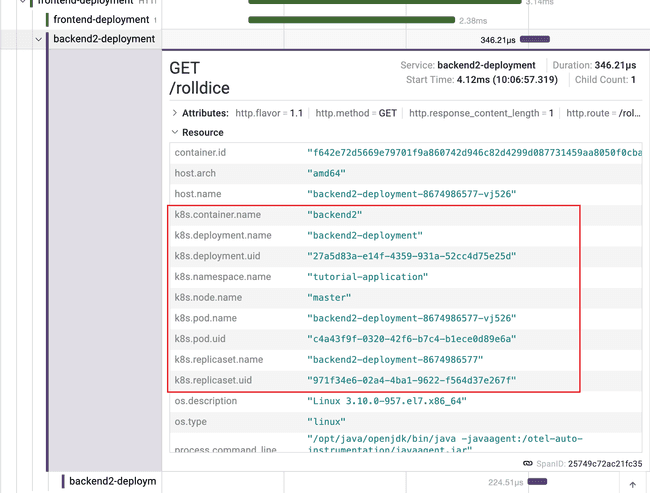
修改otelinst,然后重启服务。
Let’s enable collection of Kubernetes UID attributes. Update the Instrumentation CR:
kubectl edit instrumentations.opentelemetry.io my-instrumentation -n tutorial-application
spec:
  resource:
    addK8sUIDAttributes: true
The resource attributes are injected to the application container, to apply the change on already running applications a restart is required:
kubectl rollout restart deployment -n tutorial-application -l app=backend1
kubectl rollout restart deployment -n tutorial-application -l app=backend2
kubectl rollout restart deployment -n tutorial-application -l app=frontend
Sampling
采样控制
Sampling in OpenTelemetry SDK and auto-instrumentations is configured via OTEL_TRACES_SAMPLER and OTEL_TRACES_SAMPLER_ARG environment variables. In our demo these environment variables are configured in the Instrumentation CR.
Let’s change the sampling rate (argument) to sample 25% of requests:
kubectl edit instrumentations.opentelemetry.io my-instrumentation -n tutorial-application
# add
spec:
  sampler:
    type: parentbased_traceidratio
    argument: "0.25"
PII and data manipulation
The collector can add, change and/or remove data that is flowing through it (spans, attributes etc.). This is useful to extract new attributes that can be later used for querying. Second use-case for data manipulation is to handle personally identifiable information (PII).
The following collector processors can be used for data manipulation:
- attributesprocessor removes attributes.
- filterprocessor removes spans and attributes. It supports regex.
- redactionprocessor deletes span attributes that don’t match a list of allowed span attributes.
- transformprocessor modifies telemetry based on configuration using the OpenTelemetry Transformation Language.
kubectl edit opentelemetrycollectors.opentelemetry.io otel -n observability-backend
# add
  processors:
    attributes:
      actions:
      - key: "http.target"pattern: ^.*\?player=(?P<player>.*)
        action: extract

    service:
      pipelines:
        traces:
          processors: [memory_limiter, attributes, batch]
Metrics
Prometheus Target Discovery
Service and Pod Monitors
If you have services already generating metrics for prometheus, the collector can collect those using the prometheus receiver, which scrapes metric endpoints provided in a scrape_config like the one below:
  - job_name: 'otel-collector'scrape_interval: 10s
    static_configs:
      - targets: [ '0.0.0.0:8888' ]
This solution works but requires writing out all known targets. When services being deployed are added or changed, it will require updating this configuration. An alternative to this is to set up Prometheus Service and Pod Monitors. This allows for discovering metric endpoint dynamically and without needing to modify the collector configuration and restart all collectors.
In order to apply a pod or service monitor, the CRDs need to be installed:
kubectl apply -f https://raw.githubusercontent.com/prometheus-operator/prometheus-operator/main/example/prometheus-operator-crd/monitoring.coreos.com_servicemonitors.yaml

kubectl apply -f https://raw.githubusercontent.com/prometheus-operator/prometheus-operator/main/example/prometheus-operator-crd/monitoring.coreos.com_podmonitors.yaml
``
Target Allocator
A service called the Target Allocator can use the prometheus service and pod monitor to discover targets. The target allocator discovers the targets and then distributes both discovered and configured targets among available collectors. It must be deployed alongside a Statefulset of collectors.
部署 target allocator
backend/03-collector-prom-cr.yaml
给服务增加service monitor backend/04-servicemonitors.yaml
Logs
FileLog receiver
Filelog receiver is one of the various Receivers available on OpenTelemetry Collector Contrib.
In order to demonstrate the logs instrumentation, we have to get the OpenTelemetry Instance running as a Daemonset:
  filelog:
    include:
      - /var/log/pods/*/*/*.log
    #Each operator fulfills a single responsibility,
    #such as reading lines from a file, or parsing JSON
    #from a field. Operators are then chained together
    #in a pipeline to achieve a desired result.
    operators:
      # Parse CRI-O format
      - type: regex_parser
        id: parser-crio
        regex: '^(?P<time>[^ Z]+) (?P<stream>stdout|stderr) (?P<logtag>[^ ]*) ?(?P<log>.*)$'output: extract_metadata_from_filepath
        timestamp:
          parse_from: attributes.time
          layout_type: gotime
          layout: '2006-01-02T15:04:05.999999999Z07:00'
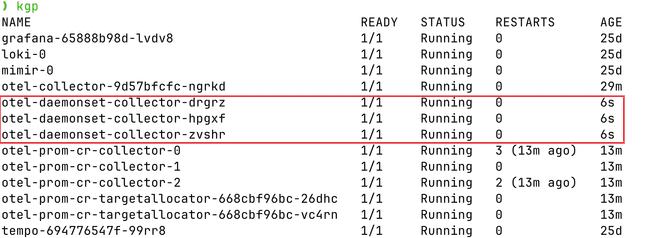
In order to demonstrate the logs instrumentation, we have to get the OpenTelemetry Instance running as a Daemonset:

OpenTelemetry Collector running as DaemonSet
kubectl apply -f https://raw.githubusercontent.com/pavolloffay/kubecon-eu-2023-opentelemetry-kubernetes-tutorial/main/backend/05-collector-daemonset.yaml页面上可以看到日志了
Roadmap
OpenTelemetry Operator Roadmap
Golang auto-instrumentation.
- Adding OpenTelemetry instrumentation to Go applications without having to modify their source code.
OpAMP Bridge.
- Open Agent Management Protocol (OpAMP) is a network protocol for remote management of large fleets of data collection Agents. The complete specification can be found here.
Simplifying the Operator CRDs.
- In order to get the OpenTelemetryCollector easier to be deployed, we are experimenting an opinionated CRDs, which will have the cofig file declared as parameters.
Configuration reload when collector running as Sidecar.
- When the OpenTelemetryCollector instance is running a sidecar will get reloaded if the config parameter changes
NA 2023
基础设施
使用的是v0.88.0版本的opentelemetry-operator,0.74版本不支持go
Auto-instrumentation
By today the OpenTelemetry Operator offers two CustomResouceDefinitions.
- The
v1alpha1.Instrumentationcan be used to configure applications that are configured with the OpenTelemetry-SDK and injection of auto-instrumentation libraries. Currently Apache HTTPD, DotNet, Go, Java, Nginx, NodeJS and Python are supported. Readme - The
v1alpha1.OpenTelemetryCollectorsimplifies the operation of the OpenTelemetry Collector on Kubernetes. There are different deployment modes available, breaking config changes are migrated automatically, provides integration with Prometheus (including operating on Prometheus Operator CRs) and simplifies sidecar injection.
apply 这个yaml,
---
apiVersion: opentelemetry.io/v1alpha1
kind: Instrumentation
metadata:
  name: demo-instrumentation
  namespace: tutorial-application
spec:
  exporter:
    endpoint: http://jaeger-collector.observability-backend.svc.cluster.local:4317
  env:
    - name: OTEL_EXPORTER_OTLP_METRICS_PROTOCOL
      value: http/protobuf
    - name: OTEL_EXPORTER_OTLP_METRICS_ENDPOINT
      value: http://prometheus.observability-backend.svc.cluster.local:80/api/v1/otlp/v1/metrics
    - name: OTEL_METRICS_EXPORTER
      value: otlp
    - name: OTEL_LOGS_EXPORTER
      value: none
  propagators:
    - tracecontext
    - baggage
    - b3
  sampler:
    type: parentbased_traceidratio
    argument: "1"
patch一下deployment
kubectl patch deployment backend2-deployment -n tutorial-application -p ’{“spec”: {“template”:{“metadata”:{“annotations”:{”instrumentation.opentelemetry.io/inject-java”:“true”}}}} }’
本地转发
kubectl port-forward -n observability-backend svc/prometheus 8080:80
kubectl port-forward -n observability-backend svc/jaeger-query 16686:16686
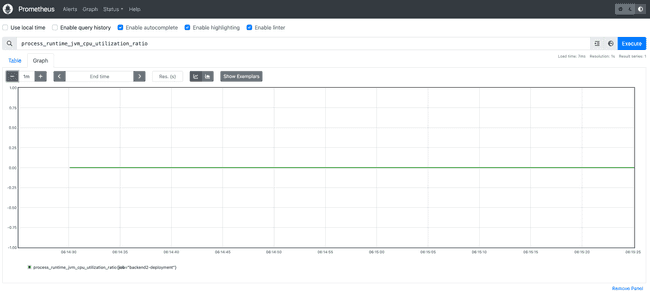
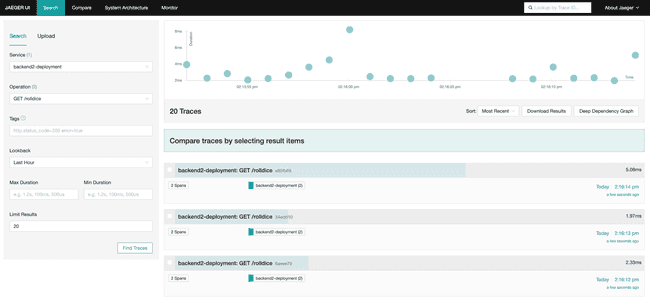
可以在granfa、jaeger分别看到metric、traces
Collector Overview

The OpenTelemetry Collector can be divided into a few major components.
- Receivers: Collect data from a specific source, like an application or infrastructure, and convert it into pData (pipeline data). This component can be active (e.g. Prometheus) or passive (OTLP).
- Processors: Manipulates the data collected by receivers in some way. For example, a processor might filter out irrelevant data, or add metadata to help with analysis. Examples include the batch or metric renaming processor.
- Exporters: Send data to an external system for storage or analysis. Examples of exporters are Prometheus, Loki or the OTLP exporter.
- Extensions: Add additional functionality to OpenTelemetry collector that is not strictly related to the telemetry data, like configuring a bearer token or offering a Jaeger remote sampling endpoint.
- Connectors: Is both an exporter and receiver. It consumes data as an exporter in one pipeline and emits data as a receiver in another pipeline.
The components are composed into pipelines, that are separated by signal type (metrics, traces, logs). Each datapoint is then goes through the chain consisting receiver(s) -> processor(s) -> exporter(s). For more details, check the offical documentation.
apply yaml
apiVersion: opentelemetry.io/v1alpha1
kind: OpenTelemetryCollector
metadata:
  name: otel-basic
  namespace: observability-backend
spec:
  image: ghcr.io/open-telemetry/opentelemetry-collector-releases/opentelemetry-collector-contrib:0.88.0
  mode: deployment
  replicas: 1
  ports:
    - port: 8888
      protocol: TCP
      name: metrics
  config: |
    receivers:
      otlp:
        protocols:
          grpc:
            endpoint: 0.0.0.0:4317
    processors:
      batch:

    exporters:
      debug:
        verbosity: detailed

    service:
      pipelines:
        metrics:
          receivers: [otlp]
          processors: [batch]
          exporters: [debug]
Collecting Prometheus Metrics
介绍了两种方法。
1. Configure Prometheus Target Discovery
使用传统的Prometheus Configuration的方式。
graph LR;
  svc(Service)
  subgraph OpenTelemetry Collector
    pr(Prometheus Receiver)
    pros(Processors)
    prw(Prometheus Remote Write Exporter)
  end
  prom(Prometheus Server)

  pr -->| /metrics | svc;
  pr --> pros;
  pros --> prw;
  prw --> |push |prom;
otelcol配置
kind: OpenTelemetryCollector
metadata:
  name: otel-prom-collector
spec:
  mode: statefulset
  replicas: 1
  config: |
    receivers:
      prometheus:
        config:
          scrape_configs:
          - job_name: 'otel-collector'
            scrape_interval: 10s
            static_configs:
            - targets: [ '0.0.0.0:8888' ]
            metric_relabel_configs:
            - action: labeldrop
              regex: (id|name)
            - action: labelmap
              regex: label_(.+)
              replacement: $$1
      exporters:
        logging:
          loglevel: debug
        prometheus:
          endpoint: 0.0.0.0:8989
          metric_expiration: 10m
        prometheusremotewrite:
          endpoint: http://prometheus.observability-backend.svc.cluster.local:80/api/v1/write
    service:
      pipelines:
        metrics:
          exporters:
          - prometheusremotewrite
          - logging
          processors: []
          receivers:
          - prometheus
2. Scaling metrics pipeline with the target allocator
sequenceDiagram
  participant Target Allocator
  participant Metrics Targets
  participant OTel Collectors
  Target Allocator ->>Metrics Targets: 1. Discover Metrics targets
  Target Allocator ->>OTel Collectors: 2. Discover available Collectors
  Target Allocator ->>Target Allocator: 3. Assign Metrics targets
  OTel Collectors ->>Target Allocator: 4. Query TA for Metrics targets to scrape
  OTel Collectors ->>Metrics Targets: 5. Scrape Metrics target
target allocator需要搭配service monitor/pod monitor使用
flowchart RL
  pm(PodMonitor)
  sm(ServiceMonitor)
  ta(Target Allocator)
  oc1(OTel Collector)
  oc2(OTel Collector)
  oc3(OTel Collector)
  ta --> pm
  ta --> sm
  oc1 --> ta
  oc2 --> ta
  oc3 --> ta
  sm ~~~|"1. Discover Prometheus Operator CRs"| sm
  ta ~~~|"2. Add job to TA scrape configuration"| ta
  oc3 ~~~|"3. Add job to OTel Collector scrape configuration"| oc3
部署有target allocator的otelcol
-
otelcol yaml
apiVersion: opentelemetry.io/v1alpha1
kind: OpenTelemetryCollector
metadata:
  name: otel-prom-app-metrics
  namespace: observability-backend
spec:
  image: ghcr.io/open-telemetry/opentelemetry-collector-releases/opentelemetry-collector-contrib:0.88.0
  mode: statefulset
  replicas: 3
  targetAllocator:
    enabled: true
    allocationStrategy: "consistent-hashing"
    replicas: 2
    image: ghcr.io/open-telemetry/opentelemetry-operator/target-allocator:0.88.0
    prometheusCR:
      enabled: true
  ports:
    - port: 8888
      protocol: TCP
      name: metrics
  config: |
    receivers:
      prometheus:
        config:
          scrape_configs:
          - job_name: 'otel-collector'
            scrape_interval: 20s
            static_configs:
            - targets: [ '0.0.0.0:8888' ]
        target_allocator:
          endpoint: http://otel-prom-app-metrics-targetallocator:80
          interval: 30s
          collector_id: ${POD_NAME}
          http_sd_config:
            refresh_interval: 60s

    processors:
      batch:
      memory_limiter:
        check_interval: 1s
        limit_percentage: 50
        spike_limit_percentage: 10

    exporters:
      logging:
        loglevel: debug
      prometheusremotewrite:
        endpoint: "http://prometheus.observability-backend.svc.cluster.local:80/api/v1/write"
        resource_to_telemetry_conversion:
          enabled: true
    service:
      telemetry:
        logs:
          level: debug
      pipelines:
        metrics:
          receivers: [prometheus]
          processors: [memory_limiter, batch]
          exporters: [logging, prometheusremotewrite]
---
apiVersion: rbac.authorization.k8s.io/v1
kind: ClusterRole
metadata:
  name: otel-prom-app-metrics-collector
rules:
  - apiGroups: [""]
    resources:
      - nodes
      - nodes/proxy
      - nodes/metrics
      - services
      - endpoints
      - pods
    verbs: ["get", "list", "watch"]
  - apiGroups: ["monitoring.coreos.com"]
    resources:
      - servicemonitors
      - podmonitors
    verbs: ["get", "list", "watch"]
  - apiGroups:
      - extensions
    resources:
      - ingresses
    verbs: ["get", "list", "watch"]
  - apiGroups:
      - networking.k8s.io
    resources:
      - ingresses
    verbs: ["get", "list", "watch"]
  - apiGroups: ["discovery.k8s.io"]
    resources:
    - endpointslices
    verbs: ["get", "list", "watch"]
  - nonResourceURLs: ["/metrics", "/metrics/cadvisor"]
    verbs: ["get"]
---
apiVersion: rbac.authorization.k8s.io/v1
kind: ClusterRoleBinding
metadata:
  name: otel-prom-app-metrics-collector
roleRef:
  apiGroup: rbac.authorization.k8s.io
  kind: ClusterRole
  name: otel-prom-app-metrics-collector
subjects:
  - kind: ServiceAccount
    # quirk of the Operator
    name: otel-prom-app-metrics-collector
    namespace: observability-backend
  - kind: ServiceAccount
    name: otel-prom-app-metrics-targetallocator
    namespace: observability-backend
  - kind: ServiceAccount
    name: backend1
    namespace: tutorial-application
部署service monitor
-
service_monitor.yaml
---
apiVersion: monitoring.coreos.com/v1
kind: ServiceMonitor
metadata:
  name: backend1-service
  namespace: tutorial-application
spec:
  selector:
    matchLabels:
      app: backend1
  namespaceSelector:
    matchNames:
      - tutorial-application
  endpoints:
    - path: /metrics/
      port: http
      interval: 20s
      scrapeTimeout: 10s
---
apiVersion: monitoring.coreos.com/v1
kind: ServiceMonitor
metadata:
  name: otel-prom-cr-targetallocator
  namespace: observability-backend
spec:
  endpoints:
    - path: /metrics
      port: targetallocation
      interval: 20s
      scrapeTimeout: 10s
  namespaceSelector:
    matchNames:
      - observability-backend
  selector:
    matchLabels:
      app.kubernetes.io/name: otel-prom-app-metrics-targetallocator
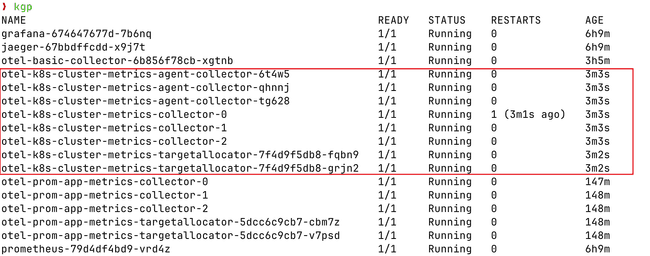
部署完成可以看到,如下pod
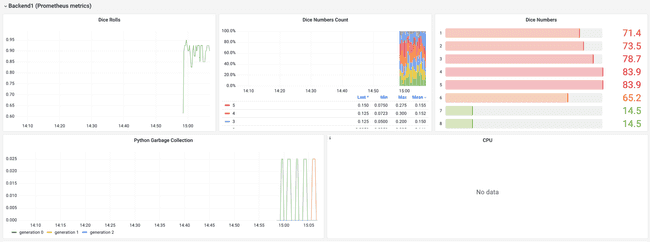
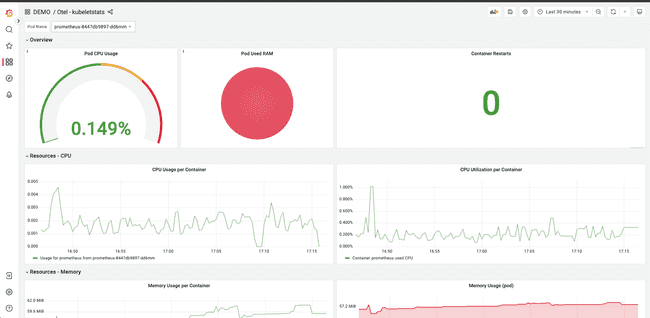
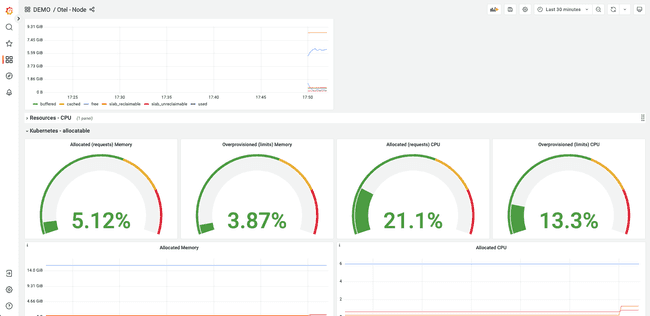
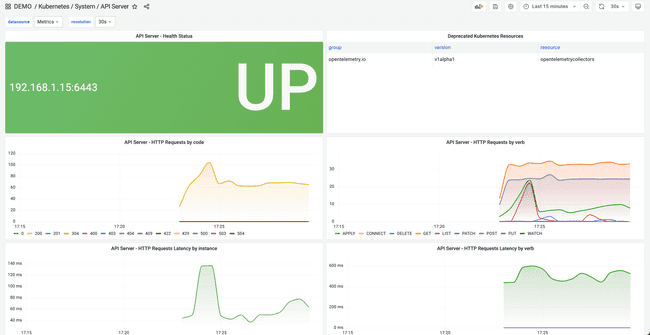
可以在granafa里看到
Collecting Kubernetes infrastracture metrics
使用了kubeletstats和hostmetrics的receivers,收集k8s的指标。
-
otle yaml
apiVersion: opentelemetry.io/v1alpha1
kind: OpenTelemetryCollector
metadata:
  name: otel-k8s-cluster-metrics-agent
  namespace: observability-backend
spec:
  image: ghcr.io/open-telemetry/opentelemetry-collector-releases/opentelemetry-collector-contrib:0.88.0
  mode: daemonset
  serviceAccount: otel-k8s-cluster-metrics-collector
  env:
  - name: K8S_NODE_NAME
    valueFrom:
      fieldRef:
        fieldPath: spec.nodeName
  - name: OTEL_RESOURCE_ATTRIBUTES
    value: k8s.node.name=$(K8S_NODE_NAME)
  volumeMounts:
  - name: hostfs
    mountPath: /hostfs
    readOnly: true
    mountPropagation: HostToContainer
  volumes:
  - name: hostfs
    hostPath:
      path: /
  ports:
    - port: 8888
      protocol: TCP
      name: metrics
  config: |
    receivers:
      kubeletstats:
        collection_interval: 20s
        auth_type: "serviceAccount"
        endpoint: "${env:K8S_NODE_NAME}:10250"
        extra_metadata_labels:
        - k8s.volume.type
        insecure_skip_verify: true
        metric_groups:
        - container
        - pod
        - volume
        - node
      hostmetrics:
        collection_interval: 10s
        root_path: /hostfs
        scrapers:
          cpu:
            metrics:
              system.cpu.utilization:
                enabled: true
          disk: null
          filesystem:
            exclude_fs_types:
              fs_types:
              - autofs
              - binfmt_misc
              - bpf
              - cgroup2
              - configfs
              - debugfs
              - devpts
              - devtmpfs
              - fusectl
              - hugetlbfs
              - iso9660
              - mqueue
              - nsfs
              - overlay
              - proc
              - procfs
              - pstore
              - rpc_pipefs
              - securityfs
              - selinuxfs
              - squashfs
              - sysfs
              - tracefs
              match_type: strict
            exclude_mount_points:
              match_type: regexp
              mount_points:
              - /dev/*
              - /proc/*
              - /sys/*
              - /run/k3s/containerd/*
              - /run/containerd/runc/*
              - /var/lib/docker/*
              - /var/lib/kubelet/*
              - /snap/*
          load: null
          memory:
            metrics:
              system.memory.utilization:
                enabled: true
          network: null

    processors:
      batch:
      memory_limiter:
        check_interval: 1s
        limit_percentage: 50
        spike_limit_percentage: 10
      k8sattributes:
        auth_type: 'serviceAccount'
        extract:
          metadata:
            - k8s.namespace.name
            - k8s.pod.name
            - k8s.pod.start_time
            - k8s.pod.uid
            - k8s.deployment.name
            - k8s.node.name
      resourcedetection/env:
        detectors:
        - env

    exporters:
      logging:
        loglevel: debug
      prometheusremotewrite:
        endpoint: "http://prometheus.observability-backend.svc.cluster.local:80/api/v1/write"
        resource_to_telemetry_conversion:
          enabled: true
    service:
      pipelines:
        metrics:
          receivers: [kubeletstats, hostmetrics]
          processors: [k8sattributes, resourcedetection/env, memory_limiter, batch]
          exporters: [logging, prometheusremotewrite]

---
apiVersion: opentelemetry.io/v1alpha1
kind: OpenTelemetryCollector
metadata:
  name: otel-k8s-cluster-metrics
  namespace: observability-backend
spec:
  image: ghcr.io/open-telemetry/opentelemetry-collector-releases/opentelemetry-collector-contrib:0.88.0
  mode: statefulset
  replicas: 3
  serviceAccount: otel-k8s-cluster-metrics-collector
  targetAllocator:
    enabled: true
    serviceAccount: otel-k8s-cluster-metrics-targetallocator
    allocationStrategy: "consistent-hashing"
    replicas: 2
    image: ghcr.io/open-telemetry/opentelemetry-operator/target-allocator:0.88.0
    prometheusCR:
      enabled: false
  env:
  - name: K8S_NODE_NAME
    valueFrom:
      fieldRef:
        fieldPath: spec.nodeName
  - name: OTEL_RESOURCE_ATTRIBUTES
    value: k8s.node.name=$(K8S_NODE_NAME)
  volumeMounts:
  - name: hostfs
    mountPath: /hostfs
    readOnly: true
    mountPropagation: HostToContainer
  volumes:
  - name: hostfs
    hostPath:
      path: /
  ports:
    - port: 8888
      protocol: TCP
      name: metrics
  config: |
    receivers:
      k8s_cluster:
        auth_type: serviceAccount
        node_conditions_to_report:
          - Ready
          - MemoryPressure
        allocatable_types_to_report:
          - cpu
          - memory
      prometheus:
        config:
          scrape_configs:
          - job_name: apiserver
            authorization:
              credentials_file: "/var/run/secrets/kubernetes.io/serviceaccount/token"
              type: Bearer
            honor_labels: true
            honor_timestamps: true
            kubernetes_sd_configs:
            - follow_redirects: true
              kubeconfig_file: ''
              role: endpoints
            metrics_path: "/metrics"
            follow_redirects: true
            relabel_configs:
            - source_labels: [__meta_kubernetes_namespace, __meta_kubernetes_service_name, __meta_kubernetes_endpoint_port_name]
              separator: ;
              regex: default;kubernetes;https
              replacement: $$1
              action: keep
            scheme: https
            scrape_interval: 20s
            scrape_timeout: 10s
            tls_config:
              ca_file: "/var/run/secrets/kubernetes.io/serviceaccount/ca.crt"
              insecure_skip_verify: true
          - job_name: kubernetes-nodes
            honor_timestamps: true
            scrape_interval: 20s
            scrape_timeout: 10s
            metrics_path: /metrics
            scheme: https
            authorization:
              type: Bearer
              credentials_file: /var/run/secrets/kubernetes.io/serviceaccount/token
            tls_config:
              ca_file: /var/run/secrets/kubernetes.io/serviceaccount/ca.crt
              insecure_skip_verify: true
            follow_redirects: true
            relabel_configs:
            - separator: ;
              regex: __meta_kubernetes_node_label_(.+)
              replacement: $$1
              action: labelmap
            - separator: ;
              regex: (.*)
              target_label: __address__
              replacement: kubernetes.default.svc:443
              action: replace
            kubernetes_sd_configs:
            - role: node
              kubeconfig_file: ""
              follow_redirects: true
          - job_name: kubernetes-nodes-cadvisor
            honor_timestamps: true
            scrape_interval: 20s
            scrape_timeout: 10s
            metrics_path: /metrics
            scheme: https
            authorization:
              type: Bearer
              credentials_file: /var/run/secrets/kubernetes.io/serviceaccount/token
            tls_config:
              ca_file: /var/run/secrets/kubernetes.io/serviceaccount/ca.crt
              insecure_skip_verify: true
            follow_redirects: true
            relabel_configs:
            - separator: ;
              regex: __meta_kubernetes_node_label_(.+)
              replacement: $$1
              action: labelmap
            - separator: ;
              regex: (.*)
              target_label: __address__
              replacement: kubernetes.default.svc:443
              action: replace
            kubernetes_sd_configs:
            - role: node
              kubeconfig_file: ""
              follow_redirects: true
          - job_name: kubernetes-service-endpoints
            honor_labels: true
            honor_timestamps: true
            scrape_interval: 20s
            scrape_timeout: 10s
            metrics_path: /metrics
            scheme: http
            follow_redirects: true
            relabel_configs:
                - action: labelmap
                  regex: __meta_kubernetes_service_label_(.+)
                - source_labels: [__meta_kubernetes_namespace]
                  action: replace
                  target_label: namespace
                - source_labels: [__meta_kubernetes_service_name]
                  action: replace
                  target_label: service
            kubernetes_sd_configs:
            - role: pod
              kubeconfig_file: ""
              follow_redirects: true
          - job_name: kubernetes-pods
            honor_labels: true
            honor_timestamps: true
            scrape_interval: 1m
            scrape_timeout: 20s
            metrics_path: /metrics
            scheme: http
            tls_config:
              ca_file: /var/run/secrets/kubernetes.io/serviceaccount/ca.crt
              insecure_skip_verify: true
            follow_redirects: true
            relabel_configs:
              - action: labelmap
                regex: __meta_kubernetes_pod_label_(.+)
              - source_labels: [__meta_kubernetes_namespace]
                action: replace
                target_label: namespace
              - source_labels: [__meta_kubernetes_pod_name]
                action: replace
                target_label: pod
            kubernetes_sd_configs:
            - role: pod
              kubeconfig_file: ""
              follow_redirects: true
        target_allocator:
          endpoint: http://otel-k8s-cluster-metrics-targetallocator:80
          interval: 30s
          collector_id: ${POD_NAME}
          http_sd_config:
            refresh_interval: 60s

    processors:
      batch:
      memory_limiter:
        check_interval: 1s
        limit_percentage: 50
        spike_limit_percentage: 10
      resourcedetection/env:
        detectors:
        - env

    exporters:
      logging:
        loglevel: debug
      prometheusremotewrite:
        endpoint: "http://prometheus.observability-backend.svc.cluster.local:80/api/v1/write"
        resource_to_telemetry_conversion:
          enabled: true
    service:
      pipelines:
        metrics:
          receivers: [prometheus, k8s_cluster]
          processors: [resourcedetection/env, memory_limiter, batch]
          exporters: [logging, prometheusremotewrite]
---
apiVersion: rbac.authorization.k8s.io/v1
kind: ClusterRole
metadata:
  name: otel-k8s-cluster-metrics-collector
rules:
  - apiGroups:
      - ''
    resources:
      - events
      - namespaces
      - namespaces/status
      - nodes
      - nodes/proxy
      - nodes/spec
      - nodes/stats
      - nodes/metrics
      - services
      - endpoints
      - replicationcontrollers
      - replicationcontrollers/status
      - resourcequotas
      - pods
      - pods/status
    verbs: ["get", "list", "watch"]
  - apiGroups:
      - apps
    resources:
      - daemonsets
      - deployments
      - replicasets
      - statefulsets
    verbs:
      - get
      - list
      - watch
  - apiGroups:
      - "monitoring.coreos.com"
    resources:
      - servicemonitors
      - podmonitors
    verbs: ["get", "list", "watch"]
  - apiGroups:
      - extensions
    resources:
      - ingresses
      - daemonsets
      - deployments
      - replicasets
    verbs: ["get", "list", "watch"]
  - apiGroups:
      - networking.k8s.io
    resources:
      - ingresses
    verbs: ["get", "list", "watch"]
  - apiGroups:
      - "discovery.k8s.io"
    resources:
      - endpointslices
    verbs: ["get", "list", "watch"]
  - apiGroups:
      - batch
    resources:
      - jobs
      - cronjobs
    verbs:
      - get
      - list
      - watch
  - apiGroups:
      - autoscaling
    resources:
      - horizontalpodautoscalers
    verbs:
      - get
      - list
      - watch
  - nonResourceURLs: ["/metrics", "/metrics/cadvisor"]
    verbs: ["get"]
---
apiVersion: rbac.authorization.k8s.io/v1
kind: ClusterRoleBinding
metadata:
  name: otel-k8s-cluster-metrics-collector
roleRef:
  apiGroup: rbac.authorization.k8s.io
  kind: ClusterRole
  name: otel-k8s-cluster-metrics-collector
subjects:
  - kind: ServiceAccount
    # quirk of the Operator
    name: otel-k8s-cluster-metrics-collector
    namespace: observability-backend
  - kind: ServiceAccount
    name: otel-k8s-cluster-metrics-targetallocator
    namespace: observability-backend
---
apiVersion: v1
kind: ServiceAccount
metadata:
  name: otel-k8s-cluster-metrics-collector
  namespace: observability-backend
---
apiVersion: v1
kind: ServiceAccount
metadata:
  name: otel-k8s-cluster-metrics-targetallocator
  namespace: observability-backend
Kubelet Stats Receiver
Kubernetes Cluster Receiver
see Kubernetes Cluster Receiver.
   k8s_cluster:
     auth_type: serviceAccount
     node_conditions_to_report:
       - Ready
       - MemoryPressure
     allocatable_types_to_report:
       - cpu
       - memory
Host Metrics Receiver
| Scraper | Supported OSs | Description |
|---|---|---|
| cpu | All except Mac | CPU utilization metrics |
| disk | All except Mac | Disk I/O metrics |
| load | All | CPU load metrics |
| filesystem | All | File System utilization metrics |
| memory | All | Memory utilization metrics |
| network | All | Network interface I/O metrics & TCP connection metrics |
| paging | All | Paging/Swap space utilization and I/O metrics |
| processes | Linux, Mac | Process count metrics |
| process | Linux, Windows, Mac | Per process CPU, Memory, and Disk I/O metrics |
There is some overlap with the Kubeletstats Receiver so if you decide to use both, it may be worth it to disable these duplicate metrics.
In order to correctly scrape node metrics, make sure to mount the hostfs volume if you want to collect the actual node’s metrics. You can inspect the configuration to see how the hostfs volume is mounted. Configuration for hostmetrics, in simplest form, looks as follows:
receivers:
  hostmetrics:
    root_path: /hostfs
    collection_interval: 10s
    scrapers:
      cpu:
      load:
      memory:
      disk:
      filesystem:
      network:
Prometheus Receiver
Kubernetes components emit metrics in Prometheus format and it has built-in support for hundreds of useful metrics that help understand the health of containers, pods, nodes, services, and internal system components, such as kube-controller-manager, kube-proxy, kube-apiserver, kube-scheduler, and kubelet. Most of the metrics for the key components come embedded with the Kubelet. For specific metrics related to these components, deployments of exporters like kube-state-metrics, node-exporter, and Blackbox Exporter are required.
set up the OpenTelemetry collector to scrape these embedded metrics. The Prometheus upstream repository provides a helpful reference for configuring scraping, which you can find here. It contains the necessary configurations for discovering pods and services in your Kubernetes cluster. Our Prometheus receiver scrape configuration includes the following defined scrape jobs:
- kubernetes-apiservers: This job pulls in metrics from the API servers.
- kubernetes-nodes: It collects metrics specific to Kubernetes nodes.
- kubernetes-pods: All pods with annotations for scraping and port specifications are scraped.
- kubernetes-service-endpoints: All service endpoints with annotations for scraping and port specifications are scraped.
- kubernetes-cadvisor: This job captures metrics from cAdvisor, providing container metrics.
Correlation
相关信息,比如k8s信息,主机信息。
Collecting Kubernetes resource attributes
The Kubernetes resource attributes can be added to metrics in a couple of different ways:
- in OpenTelemetry SDK /
OTEL_RESOURCE_ATTRIBUTESenvironment variable - in collector k8sattributesprocessor
The Kubernetes resource attributes are prefixed with k8s: k8s.pod.name, k8s.pod.uid etc.
The Kubernetes resource attributes can be added to metrics in a couple of different ways:
- in OpenTelemetry SDK /
OTEL_RESOURCE_ATTRIBUTESenvironment variable - in collector k8sattributesprocessor(need rbac)
processors:
    k8sattributes:
      passthrough: false # when true only pod IP addresses are added, that can be used later for attributes association
      extract:
        annotations:
          - tag_name: tutorial # extracts value of annotation from pods with key `annotation-one` and inserts it as a tag with key `a1`
            key: kubecon-tutorial
from: namespace-
yaml详情
---
apiVersion: rbac.authorization.k8s.io/v1
kind: ClusterRole
metadata:
  name: otel-collector
rules:
  - apiGroups: [""]
    resources: ["pods", "namespaces"]
    verbs: ["get", "watch", "list"]
  - apiGroups: ["apps"]
    resources: ["replicasets"]
    verbs: ["get", "list", "watch"]
  - apiGroups: ["extensions"]
    resources: ["replicasets"]
    verbs: ["get", "list", "watch"]
---
apiVersion: rbac.authorization.k8s.io/v1
kind: ClusterRoleBinding
metadata:
  name: otel-collector
subjects:
  - kind: ServiceAccount
    name: otel-collector
    namespace: observability-backend
roleRef:
  kind: ClusterRole
  name: otel-collector
  apiGroup: rbac.authorization.k8s.io
---
apiVersion: opentelemetry.io/v1alpha1
kind: OpenTelemetryCollector
metadata:
  name: otel
  namespace: observability-backend
spec:
  image: ghcr.io/open-telemetry/opentelemetry-collector-releases/opentelemetry-collector-contrib:0.87.0
  mode: deployment
  replicas: 1
  ports:
    - port: 8888
      protocol: TCP
      name: metrics
  config: |
    receivers:
      otlp:
        protocols:
          grpc:
          http:

    connectors:
      spanmetrics:
        exemplars:
          enabled: true

    processors:
      batch:
      memory_limiter:
        check_interval: 1s
        limit_percentage: 50
        spike_limit_percentage: 10
      k8sattributes:
        passthrough: false
        extract:
          annotations:
          - tag_name: tutorial # extracts value of annotation from pods with key `annotation-one` and inserts it as a tag with key `a1`
            key: kubecon-tutorial
            from: namespace

    exporters:
      debug:
        verbosity: detailed
      otlphttp/metrics:
        endpoint: http://prometheus.observability-backend.svc.cluster.local:80/api/v1/otlp/
        tls:
          insecure: true
      otlp/traces:
        endpoint: jaeger-collector.observability-backend.svc.cluster.local:4317
        tls:
          insecure: true
    service:
      pipelines:
        metrics:
          receivers: [otlp, spanmetrics]
          processors: [memory_limiter, k8sattributes, batch]
          exporters: [debug, otlphttp/metrics]
        traces:
          receivers: [otlp]
          processors: [memory_limiter, k8sattributes, batch]
          exporters: [otlp/traces, spanmetrics]
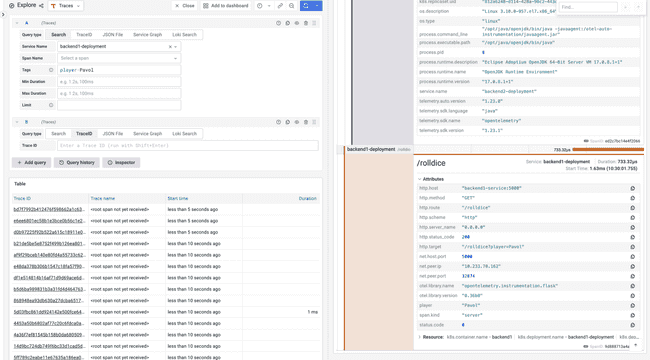
apply yaml之后可以看到
Resource Detection Processor
The resourcedetectionprocessor can be used to detect the resource information from the host. Several detectors are supported:
env: read attributes fromOTEL_RESOURCE_ATTRIBUTESsystem:host.name,host.arch,host.id,host.cpu.model.name,host.cpu.vendor.iddocker:host.name,os.typeheroku:heroku.app.id,heroku.release.commit,service.namegcp:cloud.provider(gcp),cloud.platform(gcp_app_engine),cloud.region(us-central1),cloud.availability_zone(us-central1-c),gcp.gce.instance.hostnameopenshift:cloud.provider,cloud.platform,cloud.region,k8s.cluster.name
Exemplars
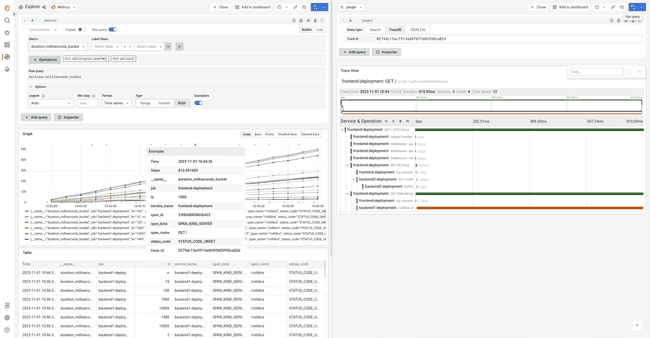
Exemplars allow correlation between aggregated metric data and the original API calls where measurements are recorded. Exemplars work for trace-metric correlation across any metric, not just those that can also be derived from Spans.
Collector: Spanmetrics Connector
The spanmetrics connector aggregates Request, Error and Duration (R.E.D) OpenTelemetry metrics from span data. It supports exemplars.
connectors:
  spanmetrics:
    exemplars:
      enabled: true
service:
  pipelines:
    traces:
      receivers: [otlp]
      exporters: [spanmetrics]
    metrics:
      receivers: [spanmetrics]
      exporters: [otlp]
Baggage
Baggage is contextual information that is passed between spans. It is a key-value store that resides alongside span context in a trace, making values available to any span created within that trace.
The baggage is propagated via W3C baggage header.
Example of setting baggage with sessionId key.
`const baggage = otelapi.propagation.getBaggage(otelApi.context.active()) || otelapi.propagation.createBaggage()
baggage.setEntry(“sessionId”, { value: “session-id-value” }) otelapi.propagation.setBaggage(otelapi.context.active(), baggage)`
EU-2024
还是熟悉的配方,apply cert-manager和opentelemetry-operator
kubectl apply -f https://github.com/cert-manager/cert-manager/releases/download/v1.11.0/cert-manager.yaml

kubectl apply -f https://github.com/open-telemetry/opentelemetry-operator/releases/download/v0.94.0/opentelemetry-operator.yaml
使用jaeger、prometheus,部署在observability-backend
observability-backend           jaeger-cb9c786c6-rl9hz
observability-backend           prometheus-79d4df4bd9-nfgjq
使用的测试应用还是之前的frontend、backend1、backend2、loadgen(自动测试的)
sequenceDiagram
    loadgen->>frontend: /?player1=bob&player2=alice
    frontend->>backend1: /rolldice?player=bob
    frontend->>backend2: /rolldice?player=alice
    backend1-->>frontend: 3
    frontend-->>loadgen: bob rolls: 3
    backend2-->>frontend: 6
    frontend-->>loadgen: alice rolls: 6
    frontend-->>loadgen: alice wins
Auto-instrumentation
-
部署
03-collector.yamlapiVersion: opentelemetry.io/v1alpha1 kind: OpenTelemetryCollector metadata: name: otel namespace: observability-backend spec: image: ghcr.io/open-telemetry/opentelemetry-collector-releases/opentelemetry-collector-contrib:0.94.0 mode: deployment replicas: 1 ports: - port: 8888 protocol: TCP name: metrics config: | receivers: otlp: protocols: grpc: endpoint: 0.0.0.0:4317 http: endpoint: 0.0.0.0:4318 processors: batch: exporters: otlp/traces: endpoint: jaeger-collector:4317 tls: insecure: true otlphttp/metrics: endpoint: http://prometheus.observability-backend.svc.cluster.local:80/api/v1/otlp/ tls: insecure: true debug: verbosity: detailed service: pipelines: traces: receivers: [otlp] processors: [batch] exporters: [otlp/traces] metrics: receivers: [otlp] exporters: [otlphttp/metrics] logs: receivers: [otlp] exporters: [debug] -
部署
instrumentation.yamlapiVersion: opentelemetry.io/v1alpha1 kind: Instrumentation metadata: name: my-instrumentation namespace: tutorial-application spec: exporter: endpoint: http://otel-collector.observability-backend.svc.cluster.local:4317 propagators: - tracecontext - baggage - b3 sampler: type: parentbased_traceidratio argument: "1" resource: addK8sUIDAttributes: true python: env: # Required if endpoint is set to 4317. # Python autoinstrumentation uses http/proto by default # so data must be sent to 4318 instead of 4317. - name: OTEL_EXPORTER_OTLP_ENDPOINT value: http://otel-collector.observability-backend.svc.cluster.local:4318 java: env: - name: OTEL_LOGS_EXPORTER value: otlp
需要patch annotations
kubectl patch deployment frontend-deployment -n tutorial-application -p '{"spec": {"template":{"metadata":{"annotations":{"instrumentation.opentelemetry.io/inject-sdk":"true"}}}} }'
kubectl patch deployment backend1-deployment -n tutorial-application -p '{"spec": {"template":{"metadata":{"annotations":{"instrumentation.opentelemetry.io/inject-python":"true"}}}} }'
kubectl patch deployment backend2-deployment -n tutorial-application -p '{"spec": {"template":{"metadata":{"annotations":{"instrumentation.opentelemetry.io/inject-java":"true"}}}} }'
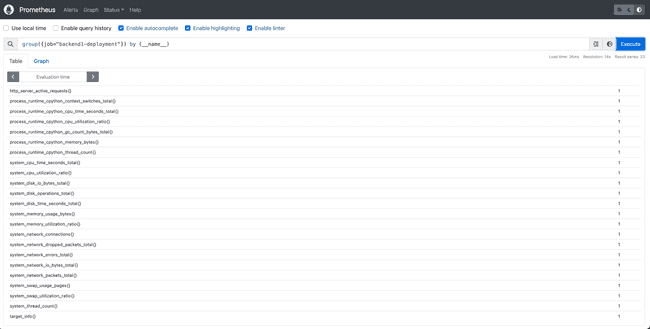
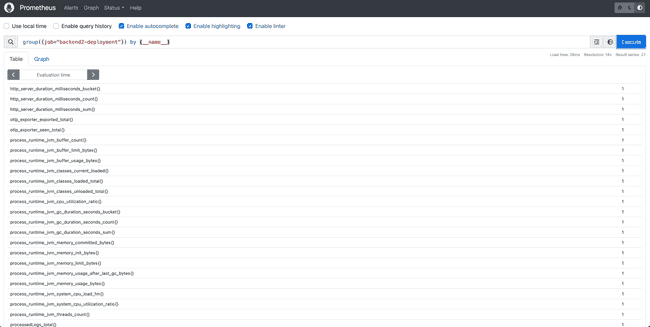
In addition to traces in the Java auto-instrumentation also emits logs and metrics. The logs in our case are printed into the collector stdout via debug exporter and metrics are sent via OTLP HTTP into Prometheus. The OpenTelemetry spec defines that the following metrics should be collected: HTTP metrics.
Customize Java auto-instrumentation with config (capture more data)
configure the Java auto-instrumentation by modifying Instrumentation CR to:
- create custom spans - for the main method of the application
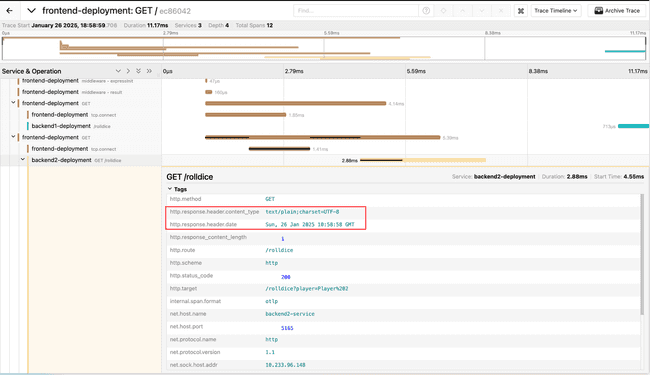
- capture server response HTTP headers
See the Java agent docs with all the configuration options.
-
部署
instrumentation-java-custom-config.yamlapiVersion: opentelemetry.io/v1alpha1 kind: Instrumentation metadata: name: my-instrumentation namespace: tutorial-application spec: exporter: endpoint: http://otel-collector.observability-backend.svc.cluster.local:4317 propagators: - tracecontext - baggage - b3 sampler: type: parentbased_traceidratio argument: "1" resource: addK8sUIDAttributes: false python: env: # Required if endpoint is set to 4317. # Python autoinstrumentation uses http/proto by default # so data must be sent to 4318 instead of 4317. - name: OTEL_EXPORTER_OTLP_ENDPOINT value: http://otel-collector.observability-backend.svc.cluster.local:4318 java: env: - name: OTEL_INSTRUMENTATION_METHODS_INCLUDE value: io.opentelemetry.dice.DiceApplication[main]; - name: OTEL_INSTRUMENTATION_HTTP_SERVER_CAPTURE_RESPONSE_HEADERS value: Content-Type,Date # - name: OTEL_INSTRUMENTATION_TOMCAT_ENABLED # value: "false" # - name: OTEL_INSTRUMENTATION_SERVLET_ENABLED # value: "false"
kubectl apply -f instrumentation-java-custom-config.yaml
kubectl rollout restart deployment.apps/backend2-deployment -n tutorial-application
kubectl get pods -w -n tutorial-application
Customize Java auto-instrumentation with code (capture more data)
提供了一个代码。
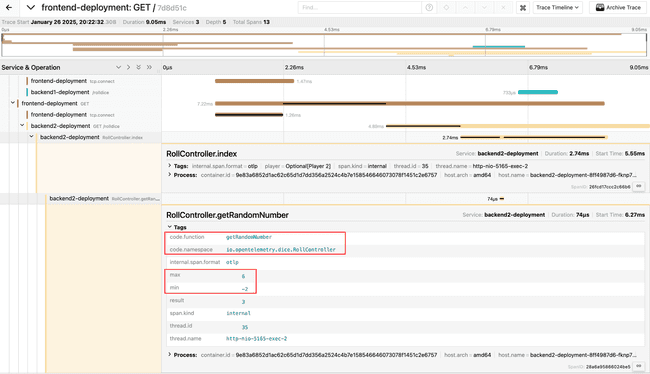
Open the RollController.java and use the annotations:
# app/backend2/build.gradle
#   implementation 'io.opentelemetry.instrumentation:opentelemetry-instrumentation-annotations:2.1.0'
#   implementation 'io.opentelemetry:opentelemetry-api:1.35.0'

    import io.opentelemetry.api.trace.Span;
    import io.opentelemetry.instrumentation.annotations.WithSpan;
    import io.opentelemetry.instrumentation.annotations.SpanAttribute;
    import io.opentelemetry.instrumentation.annotations.AddingSpanAttributes;

    @AddingSpanAttributes
	@GetMapping("/rolldice")
	public String index(@SpanAttribute("player") @RequestParam("player") Optional<String> player) {

    @WithSpan
    public int getRandomNumber(@SpanAttribute("min") int min, @SpanAttribute("max") int max) {
        int result = (int) ((Math.random() * (max - min)) + min);
        Span span = Span.current();
        span.setAttribute("result", result);
        return result;
    }
Compile it and deploy:
cd app/backend2

# Use minikube's docker registry
# eval $(minikube -p minikube docker-env)
docker build -t ghcr.io/pavolloffay/kubecon-eu-2024-opentelemetry-kubernetes-tracing-tutorial-backend2:withspan .
# docker push ghcr.io/pavolloffay/kubecon-eu-2024-opentelemetry-kubernetes-tracing-tutorial-backend2:withspan

kubectl set image deployment.apps/backend2-deployment backend2=ghcr.io/pavolloffay/kubecon-eu-2024-opentelemetry-kubernetes-tracing-tutorial-backend2:withspan -n tutorial-application
kubectl get pods -w -n tutorial-application
Manual instrumentation using the OpenTelemetry SDK
-
golang code
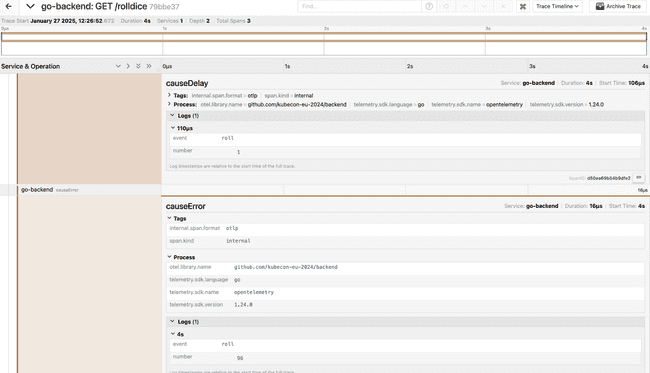
package main import ( "context" "crypto/sha256" "fmt" "math/rand" "net/http" "os" "strconv" "strings" "time" "github.com/prometheus/client_golang/prometheus" "github.com/prometheus/client_golang/prometheus/promhttp" "go.opentelemetry.io/contrib/instrumentation/net/http/otelhttp" "go.opentelemetry.io/otel" "go.opentelemetry.io/otel/attribute" "go.opentelemetry.io/otel/codes" "go.opentelemetry.io/otel/exporters/otlp/otlptrace/otlptracegrpc" sdktrace "go.opentelemetry.io/otel/sdk/trace" "go.opentelemetry.io/otel/trace" ) var tracer = otel.GetTracerProvider().Tracer("github.com/kubecon-eu-2024/backend") var ( rollCounter = prometheus.NewCounter( prometheus.CounterOpts{ Name: "dice_roll_count", Help: "How often the dice was rolled", }, ) numbersCounter = prometheus.NewCounterVec( prometheus.CounterOpts{ Name: "dice_numbers_count", Help: "How often each number of the dice was rolled", }, []string{"number"}, ) ) func init() { prometheus.MustRegister(rollCounter) prometheus.MustRegister(numbersCounter) } func main() { otelExporter, err := otlptracegrpc.New(context.Background()) if err != nil { fmt.Printf("failed to create trace exporter: %s", err) os.Exit(1) } tp := sdktrace.NewTracerProvider(sdktrace.WithBatcher(otelExporter)) otel.SetTracerProvider(tp) v, ok := os.LookupEnv("RATE_ERROR") if !ok { v = "0" } rateError, err := strconv.Atoi(v) if err != nil { panic(err) } v, ok = os.LookupEnv("RATE_HIGH_DELAY") if !ok { v = "0" } rateDelay, err := strconv.Atoi(v) if err != nil { panic(err) } mux := http.NewServeMux() registerHandleFunc := func(pattern string, h http.HandlerFunc) { route := strings.Split(pattern, " ") mux.Handle(pattern, otelhttp.NewHandler(otelhttp.WithRouteTag(route[len(route)-1], h), pattern)) } registerHandleFunc("GET /rolldice", func(w http.ResponseWriter, r *http.Request) { player := "Anonymous player" if p := r.URL.Query().Get("player"); p != "" { player = p } trace.SpanFromContext(r.Context()).AddEvent("determine player", trace.WithAttributes(attribute.String("player.name", player))) max := 8 if fmt.Sprintf("%x", sha256.Sum256([]byte(player))) == "f4b7c19317c929d2a34297d6229defe5262fa556ef654b600fc98f02c6d87fdc" { max = 8 } else { max = 6 } result := doRoll(r.Context(), max) causeDelay(r.Context(), rateDelay) if err := causeError(r.Context(), rateError); err != nil { w.WriteHeader(http.StatusInternalServerError) return } resStr := strconv.Itoa(result) rollCounter.Inc() numbersCounter.WithLabelValues(resStr).Inc() if _, err := w.Write([]byte(resStr)); err != nil { w.WriteHeader(http.StatusInternalServerError) } }) registerHandleFunc("GET /metrics", promhttp.Handler().ServeHTTP) srv := &http.Server{ Addr: "0.0.0.0:5165", Handler: mux, } if err := srv.ListenAndServe(); err != nil { panic(err) } } func causeError(ctx context.Context, rate int) error { _, span := tracer.Start(ctx, "causeError") defer span.End() randomNumber := rand.Intn(100) span.AddEvent("roll", trace.WithAttributes(attribute.Int("number", randomNumber))) if randomNumber < rate { err := fmt.Errorf("number(%d)) < rate(%d)", randomNumber, rate) span.RecordError(err) span.SetStatus(codes.Error, "some error occured") return err } return nil } func causeDelay(ctx context.Context, rate int) { _, span := tracer.Start(ctx, "causeDelay") defer span.End() randomNumber := rand.Intn(100) span.AddEvent("roll", trace.WithAttributes(attribute.Int("number", randomNumber))) if randomNumber < rate { time.Sleep(time.Duration(2+rand.Intn(3)) * time.Second) } } func doRoll(_ context.Context, max int) int { return rand.Intn(max) + 1 } -
yaml
apiVersion: apps/v1
kind: Deployment
metadata:
  name: backend2-deployment
  namespace: tutorial-application
  labels:
    app: backend2
spec:
  replicas: 1
  selector:
    matchLabels:
      app: backend2
  template:
    metadata:
      labels:
        app: backend2
      annotations:
        prometheus.io/scrape: "true"
        instrumentation.opentelemetry.io/inject-sdk: "true"
    spec:
      containers:
      - name: backend2
        image: ghcr.io/pavolloffay/kubecon-eu-2024-opentelemetry-kubernetes-tracing-tutorial-backend4:latest
        ports:
        - containerPort: 5165
        env:
        - name: RATE_ERROR
          value: "20"
        - name: RATE_HIGH_DELAY
          value: "20"
        # NOTE: alternative to instrumentation annotation
        - name: OTEL_EXPORTER_OTLP_ENDPOINT
          value: "http://otel-collector.observability-backend.svc.cluster.local:4317"
        - name: OTEL_SERVICE_NAME
          value: "go-backend"
Add a custom Event
AddEvent adds an event with the provided name and optionsAddEvent adds an event with the provided name and options.
func causeDelay(ctx context.Context, rate int) {
+	_, span := tracer.Start(ctx, "causeDelay")
+	defer span.End()
	randomNumber := rand.Intn(100)
+	span.AddEvent("roll", trace.WithAttributes(attribute.Int("number", randomNumber)))
	if randomNumber < rate {
		time.Sleep(time.Duration(2+rand.Intn(3)) * time.Second)
	}
}
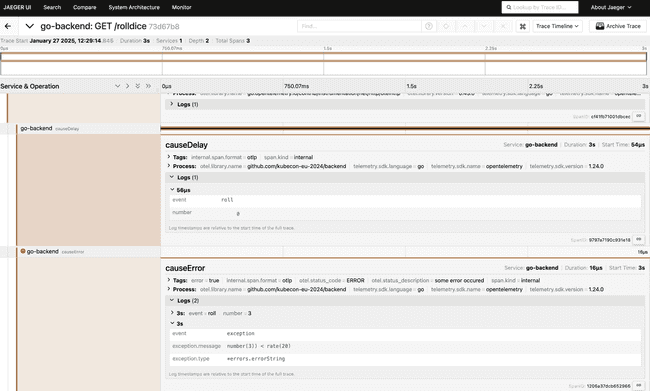
RecordError and set span status
RecordError will record err as an exception span event for this span. An additional call to SetStatus is required if the Status of the Span should be set to Error, as this method does not change the Span status. If this span is not being recorded or err is nil then this method does nothing.
func causeError(ctx context.Context, rate int) error {
+	_, span := tracer.Start(ctx, "causeError")
+	defer span.End()

	randomNumber := rand.Intn(100)
+	span.AddEvent("roll", trace.WithAttributes(attribute.Int("number", randomNumber)))
	if randomNumber < rate {
		err := fmt.Errorf("number(%d)) < rate(%d)", randomNumber, rate)
+		span.RecordError(err)
+		span.SetStatus(codes.Error, "some error occured")
		return err
	}
	return nil
}
Sampling
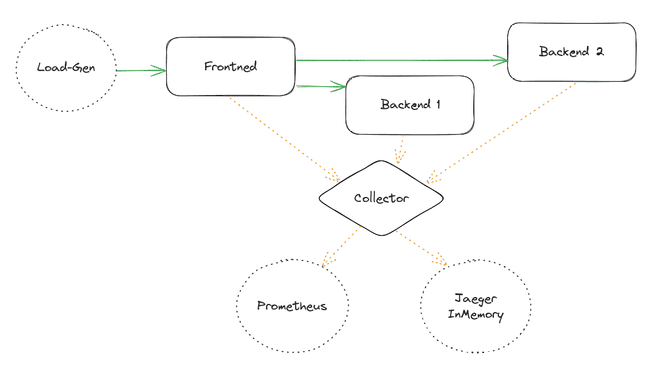
The following diagram illustrates how the telemetry data collected there is exported and stored. excalidraw
head-sampling
For the list of all available samplers, check the offical documentation
Auto Instrumentation
Update the sampling % in the Auto Instrumentation CR and restart the deployment for the configurations to take effect.
 sampler:
   type: parentbased_traceidratio
   argument: "0.5"
Manual Instrumentation
You can also configure the ParentBasedTraceIdRatioSampler in code.A Sampler can be set on the tracer provider using the WithSampler option, as follows:
provider := trace.NewTracerProvider(
    trace.WithSampler(trace.NewParentBasedTraceIdRatioSampler(0.5)),
)
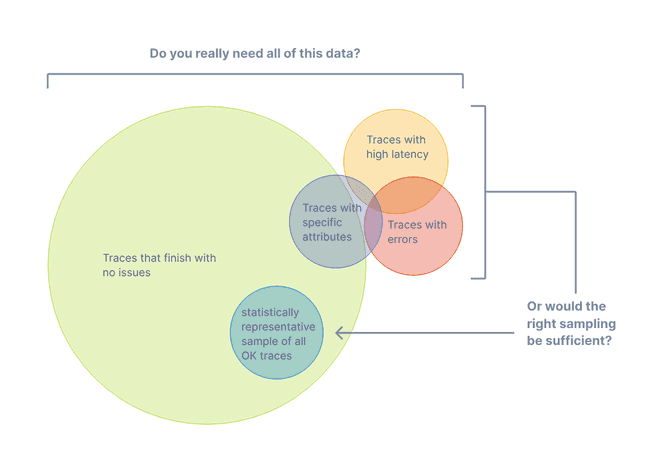
tail-sampling
-
Sample 100% of traces with ERROR-ing spans
-
Sample 100% of trace which have a duration longer than 500ms
-
Randomized sampling of 10% of traces without errors and latencies.
-
yaml
apiVersion: opentelemetry.io/v1alpha1
kind: OpenTelemetryCollector
metadata:
  name: otel
  namespace: observability-backend
spec:
  image: ghcr.io/open-telemetry/opentelemetry-collector-releases/opentelemetry-collector-contrib:0.94.0
  mode: deployment
  replicas: 1
  ports:
    - port: 8888
      protocol: TCP
      name: metrics
  config: |
    receivers:
      otlp:
        protocols:
          grpc:
            endpoint: 0.0.0.0:4317
          http:
            endpoint: 0.0.0.0:4318

    processors:
      tail_sampling:
        decision_wait: 10s # time to wait before making a sampling decision
        num_traces: 100 # number of traces to be kept in memory
        expected_new_traces_per_sec: 10 # expected rate of new traces per second
        policies:
          - name: keep-errors
            type: status_code
            status_code: {status_codes: [ERROR]}
          - name: keep-slow-traces
            type: latency
            latency: {threshold_ms: 500}
          - name: randomized-policy
            type: probabilistic
            probabilistic: {sampling_percentage: 10}

    exporters:
      otlp/traces:
        endpoint: jaeger-collector:4317
        tls:
          insecure: true

      otlphttp/metrics:
        endpoint: http://prometheus.observability-backend.svc.cluster.local:80/api/v1/otlp/
        tls:
          insecure: true

      debug:
        verbosity: detailed

    service:
      pipelines:
        traces:
          receivers: [otlp]
          processors: [tail_sampling]
          exporters: [otlp/traces]
        metrics:
          receivers: [otlp]
          exporters: [otlphttp/metrics]
        logs:
          receivers: [otlp]
          exporters: [debug]
You also have the flexibility to add other policies. For the list of all policies, check the offical documentation
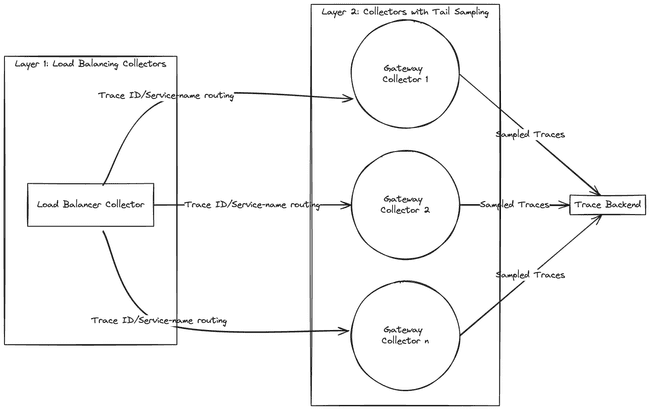
Advanced Topic: Tail Sampling at scale with OpenTelemetry
with the first layer routing all spans of a trace to the same collector in the downstream deployment (using a load-balancing exporter), and the second layer performing the tail sampling.
-
yaml
apiVersion: opentelemetry.io/v1alpha1
kind: OpenTelemetryCollector
metadata:
  name: otel
  namespace: observability-backend
spec:
  image: ghcr.io/open-telemetry/opentelemetry-collector-releases/opentelemetry-collector-contrib:0.94.0
  mode: deployment
  replicas: 1
  ports:
    - port: 8888
      protocol: TCP
      name: metrics
  config: |
    receivers:
      otlp:
        protocols:
          grpc:
            endpoint: 0.0.0.0:4317
          http:
            endpoint: 0.0.0.0:4318

    processors:
      batch:

    exporters:
      debug:
        verbosity: detailed
      loadbalancing:
        routing_key: "traceID"
        protocol:
          otlp:
            timeout: 1s
            tls:
              insecure: true
        resolver:
          k8s:
            service: otel-gateway.observability-backend
            ports:
              - 4317

      otlphttp/metrics:
        endpoint: http://prometheus.observability-backend.svc.cluster.local:80/api/v1/otlp/
        tls:
          insecure: true

      debug:
        verbosity: detailed

    service:
      pipelines:
        traces:
          receivers: [otlp]
          processors: [batch]
          exporters: [loadbalancing]
        metrics:
          receivers: [otlp]
          exporters: [otlphttp/metrics]
        logs:
          receivers: [otlp]
          exporters: [debug]
---
apiVersion: opentelemetry.io/v1alpha1
kind: OpenTelemetryCollector
metadata:
  name: otel-gateway
  namespace: observability-backend
spec:
  image: ghcr.io/open-telemetry/opentelemetry-collector-releases/opentelemetry-collector-contrib:0.94.0
  mode: statefulset
  replicas: 2
  ports:
    - port: 8888
      protocol: TCP
      name: metrics
  config: |
    receivers:
      otlp:
        protocols:
          grpc:
            endpoint: 0.0.0.0:4317
          http:
            endpoint: 0.0.0.0:4318

    processors:
      tail_sampling:
        decision_wait: 10s # time to wait before making a sampling decision is made
        num_traces: 100 # number of traces to be kept in memory
        expected_new_traces_per_sec: 10 # expected rate of new traces per second
        policies:
          - name: keep-errors
            type: status_code
            status_code: {status_codes: [ERROR]}
          - name: keep-slow-traces
            type: latency
            latency: {threshold_ms: 500}
          - name: randomized-policy
            type: probabilistic
            probabilistic: {sampling_percentage: 10}

    exporters:
      otlp/traces:
        endpoint: jaeger-collector:4317
        tls:
          insecure: true

      otlphttp/metrics:
        endpoint: http://prometheus.observability-backend.svc.cluster.local:80/api/v1/otlp/
        tls:
          insecure: true

      debug:
        verbosity: detailed

    service:
      pipelines:
        traces:
          receivers: [otlp]
          processors: [tail_sampling]
          exporters: [otlp/traces]
        metrics:
          receivers: [otlp]
          exporters: [otlphttp/metrics]
        logs:
          receivers: [otlp]
          exporters: [debug]
Advanced Topic: Jaeger’s Remote Sampling extension
This extension allows serving sampling strategies following the Jaeger’s remote sampling API. This extension can be configured to proxy requests to a backing remote sampling server, which could potentially be a Jaeger Collector down the pipeline, or a static JSON file from the local file system.
Example Configuration
extensions:
  jaegerremotesampling:
    source:
      reload_interval: 30s
      remote:
        endpoint: jaeger-collector:14250
  jaegerremotesampling/1:
    source:
      reload_interval: 1s
      file: /etc/otelcol/sampling_strategies.json
  jaegerremotesampling/2:
    source:
      reload_interval: 1s
      file: http://jaeger.example.com/sampling_strategies.json
For more details, check the offical documentation
RED Metrics
the spanmetrics connector in a separate collector pipeline. This connector will derive Rate, Error, and Duration (RED) metrics from the spans it processes.
-
yaml
apiVersion: opentelemetry.io/v1alpha1
kind: OpenTelemetryCollector
metadata:
  name: otel
  namespace: observability-backend
spec:
  image: ghcr.io/open-telemetry/opentelemetry-collector-releases/opentelemetry-collector-contrib:0.94.0
  mode: deployment
  replicas: 1
  ports:
    - port: 8888
      protocol: TCP
      name: metrics
  config: |
    receivers:
      otlp:
        protocols:
          grpc:
            endpoint: 0.0.0.0:4317
          http:
            endpoint: 0.0.0.0:4318

    processors:
      tail_sampling:
        decision_wait: 10s # time to wait before making a sampling decision
        num_traces: 100 # number of traces to be kept in memory
        expected_new_traces_per_sec: 10 # expected rate of new traces per second
        policies:
          - name: keep-errors
            type: status_code
            status_code: {status_codes: [ERROR]}
          - name: keep-slow-traces
            type: latency
            latency: {threshold_ms: 500}
          - name: randomized-policy
            type: probabilistic
            probabilistic: {sampling_percentage: 10}

    exporters:
      otlp/traces:
        endpoint: jaeger-collector:4317
        tls:
          insecure: true

      otlphttp/metrics:
        endpoint: http://prometheus.observability-backend.svc.cluster.local:80/api/v1/otlp/
        tls:
          insecure: true

      debug:
        verbosity: detailed

    connectors:
      spanmetrics:

    service:
      pipelines:
        traces:
          receivers: [otlp]
          processors: [tail_sampling]
          exporters: [otlp/traces]
        traces/spanmetrics:
          receivers: [otlp]
          exporters: [spanmetrics]
        metrics:
          receivers: [otlp,spanmetrics]
          exporters: [otlphttp/metrics]
        logs:
          receivers: [otlp]
          exporters: [debug]
Jaeger Configuration
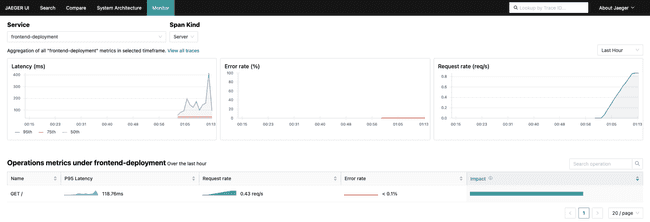
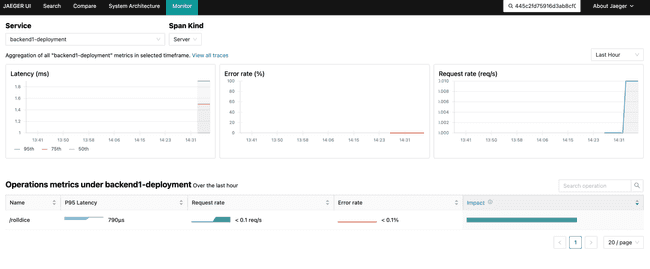
To tie together our new RED metrics with our trace data we can configure Jaeger to display service performance metrics from Prometheus. We can do this by adding environment variables that tell Jaeger where to find metrics and how to interpret them.
- name: METRICS_STORAGE_TYPE
  value: "prometheus"
- name: PROMETHEUS_SERVER_URL
  value: "http://prometheus.observability-backend"
- name: PROMETHEUS_QUERY_SUPPORT_SPANMETRICS_CONNECTOR
  value: "true"
- name: PROMETHEUS_QUERY_NORMALIZE_CALLS
  value: "true"
- name: PROMETHEUS_QUERY_NORMALIZE_DURATION
  value: "true"
OpenTelemetry Transformation Language and Spans (OTTL)
The OpenTelemetry Transformation Language (OTTL) is a powerful language that allows you to transform telemetry data flowing through the Collector. The transformation of data is executed based on OTTL statements, which define how the telemetry should be transformed. It is a stand-alone part of the Collector codebase that is (re)used in several components, such as filterprocessor, transformprocessor or routingprocessor.
Contexts
Context determines which part of telemetry data should the statement be applied to. This can be universal for all signals, such as Resource and Instrumentation Scope, or they differ depending on the type of the signal such Span, Datapoint or Log. In the statement, a particular part of the context can be accessed via paths, which support the familiar . notation and accessing particular keys with [] (see the example above - attributes["client_error"] - accessing a particular attribute). Full list of all contexts can be found here.
Functions
OTTL provides a list of predefined functions that come in two flavors - editors and converters. Editors work directly on and transform telemetry itself. Editors functions include functions such as a set, delete_key, replace_match or limit. Conversely, converters are used to transform input within a statement and they do not modify the telemetry themselves. These can be used e.g. to get input length (Len), manipulate strings (Concat) or assert types (IsInt, IsMap, IsString…). Full list of both types of functions can be found here
inspect the configuration for our transformprocessor below:
processors:
    transform:
        error_mode: ignore
        trace_statements:
            - context: span
            statements:
                - set(attributes["app.player1"], Substring(attributes["app.player1"], 0, 1)) where attributes["app.player1"] != ""
- set(attributes["app.player2"], Substring(attributes["app.player2"], 0, 1)) where attributes["app.player2"] != ""processors:
transform:
error_mode: ignore
trace_statements:
- context: span
statements:
- set(attributes["app.player1"], Substring(attributes["app.player1"], 0, 1)) where attributes["app.player1"] != ""
- set(attributes["app.player2"], Substring(attributes["app.player2"], 0, 1)) where attributes["app.player2"] != ""
- replace_all_patterns(attributes, "value", "player1=[a-zA-Z]*", "player1={playerName}")
- replace_all_patterns(attributes, "value", "player2=[a-zA-Z]*", "player2={playerName}")
-
yaml
apiVersion: opentelemetry.io/v1alpha1
kind: OpenTelemetryCollector
metadata:
  name: otel
  namespace: observability-backend
spec:
  image: ghcr.io/open-telemetry/opentelemetry-collector-releases/opentelemetry-collector-contrib:0.94.0
  mode: deployment
  replicas: 1
  ports:
    - port: 8888
      protocol: TCP
      name: metrics
  config: |
    receivers:
      otlp:
        protocols:
          grpc:
            endpoint: 0.0.0.0:4317
          http:
            endpoint: 0.0.0.0:4318

    processors:
      batch:
      transform:
        error_mode: ignore
        trace_statements:
          - context: span
            statements:
                - set(attributes["app.player1"], Substring(attributes["app.player1"], 0, 1)) where attributes["app.player1"] != ""
                - set(attributes["app.player2"], Substring(attributes["app.player2"], 0, 1)) where attributes["app.player2"] != ""
                - replace_all_patterns(attributes, "value", "player1=[a-zA-Z_]*", "player1={playerName}")
                - replace_all_patterns(attributes, "value", "player2=[a-zA-Z_]*", "player2={playerName}")

    exporters:
      otlp/traces:
        endpoint: jaeger-collector:4317
        tls:
          insecure: true

      otlphttp/metrics:
        endpoint: http://prometheus.observability-backend.svc.cluster.local:80/api/v1/otlp/
        tls:
          insecure: true

      debug:
        verbosity: detailed

    service:
      pipelines:
        traces:
          receivers: [otlp]
          processors: [transform, batch]
          exporters: [otlp/traces]
        metrics:
          receivers: [otlp]
          exporters: [otlphttp/metrics]
        logs:
          receivers: [otlp]
          exporters: [debug]
Trace your k8s environment with OpenTelemetry
Deploy OpenTelemetry Collector as Daemonset with hostnetowrk access:
-
yaml
---
apiVersion: opentelemetry.io/v1alpha1
kind: OpenTelemetryCollector
metadata:
  name: system-tracing
  namespace: kube-system
spec:
  mode: daemonset
  hostNetwork: true
  config: |
    receivers:
      otlp:
        protocols:
          grpc:
            endpoint: 0.0.0.0:4317
    processors:

    exporters:
      otlp:
        endpoint: "otel-collector.observability-backend.svc.cluster.local:4317"
        tls:
          insecure: true
    service:
      pipelines:
        traces:
          receivers: [otlp]
          processors: []
          exporters: [otlp]
ETCD
spec:
  containers:
  - command:
    - etcd
    - --data-dir=/var/lib/etcd
+   - --experimental-distributed-tracing-address=127.0.0.1:4317
+   - --experimental-distributed-tracing-instance-id=caf201fd-8d5b-467b-a70f-09ad3beb5a21
+   - --experimental-distributed-tracing-sampling-rate=1000000
+   - --experimental-distributed-tracing-service-name=etcd
+   - --experimental-enable-distributed-tracing=true
    - --experimental-initial-corrupt-check=true
    image: quay.io/coreos/etcd:v3.5.11
  hostNetwork: true
API-Server
spec:
  containers:
  - command:
    - kube-apiserver
    - --authorization-mode=Node,RBAC
-   - --feature-gates=KubeletInUserNamespace=true
+   - --feature-gates=APIServerTracing=true,KubeletInUserNamespace=true
+   - --tracing-config-file=/api-server/tracing-config.yaml
    image: registry.k8s.io/kube-apiserver:v1.29.1
  hostNetwork: true
  nodeName: kind-control-plane
  priorityClassName: system-node-critical
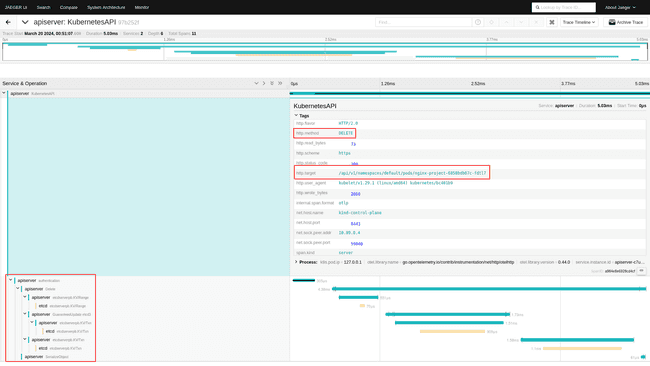
Once the API-Server and ETCD are reporting telemetry data we can make some noise by creating and deleting an nginx instance:
$ kubectl create deployment nginx-project --image=nginx
deployment.apps/nginx-project created
---
$ kubectl get deployments.apps
NAME            READY   UP-TO-DATE   AVAILABLE   AGE
nginx-project   1/1     1            1           1m
---
$ kubectl delete deployments.apps nginx-project
deployment.apps "nginx-project" deleted
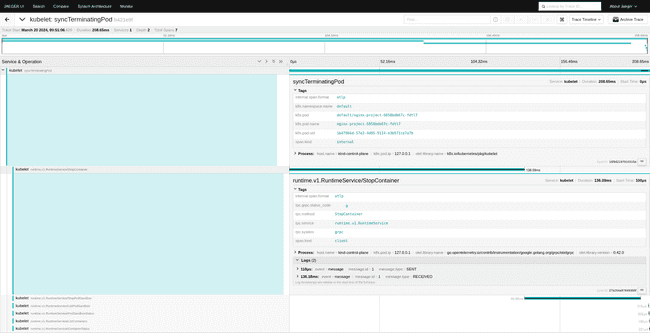
Kubelet
This should be the effect:
    apiVersion: kubelet.config.k8s.io/v1beta1
    featureGates:
      KubeletInUserNamespace: true
+     KubeletTracing: true
  ...
    syncFrequency: 0s
+   tracing:
+     endpoint: otel-collector.observability-backend.svc.cluster.local:4317
+     samplingRatePerMillion: 1000000
    volumeStatsAggPeriod: 0s
kubecon-eu-2023-opentelemetry-kubernetes-tutorial
kubecon-na-2023-opentelemetry-kubernetes-metrics-tutorial
[kubecon-eu-2024-opentelemetry-kubernetes-tracing-tutorial](https://www.notion.so/kubecon-eu-2024-opentelemetry-kubernetes-tracing-tutorial-73cc3f20c41b483cba868a4fb2cd5319?pvs=21)
